
Loop Timing Witness








The coverage badge describes Python host/tool reports. Native and RTL proof scopes are documented in the coverage guide. Download history and missing-data handling are described in repository metrics.
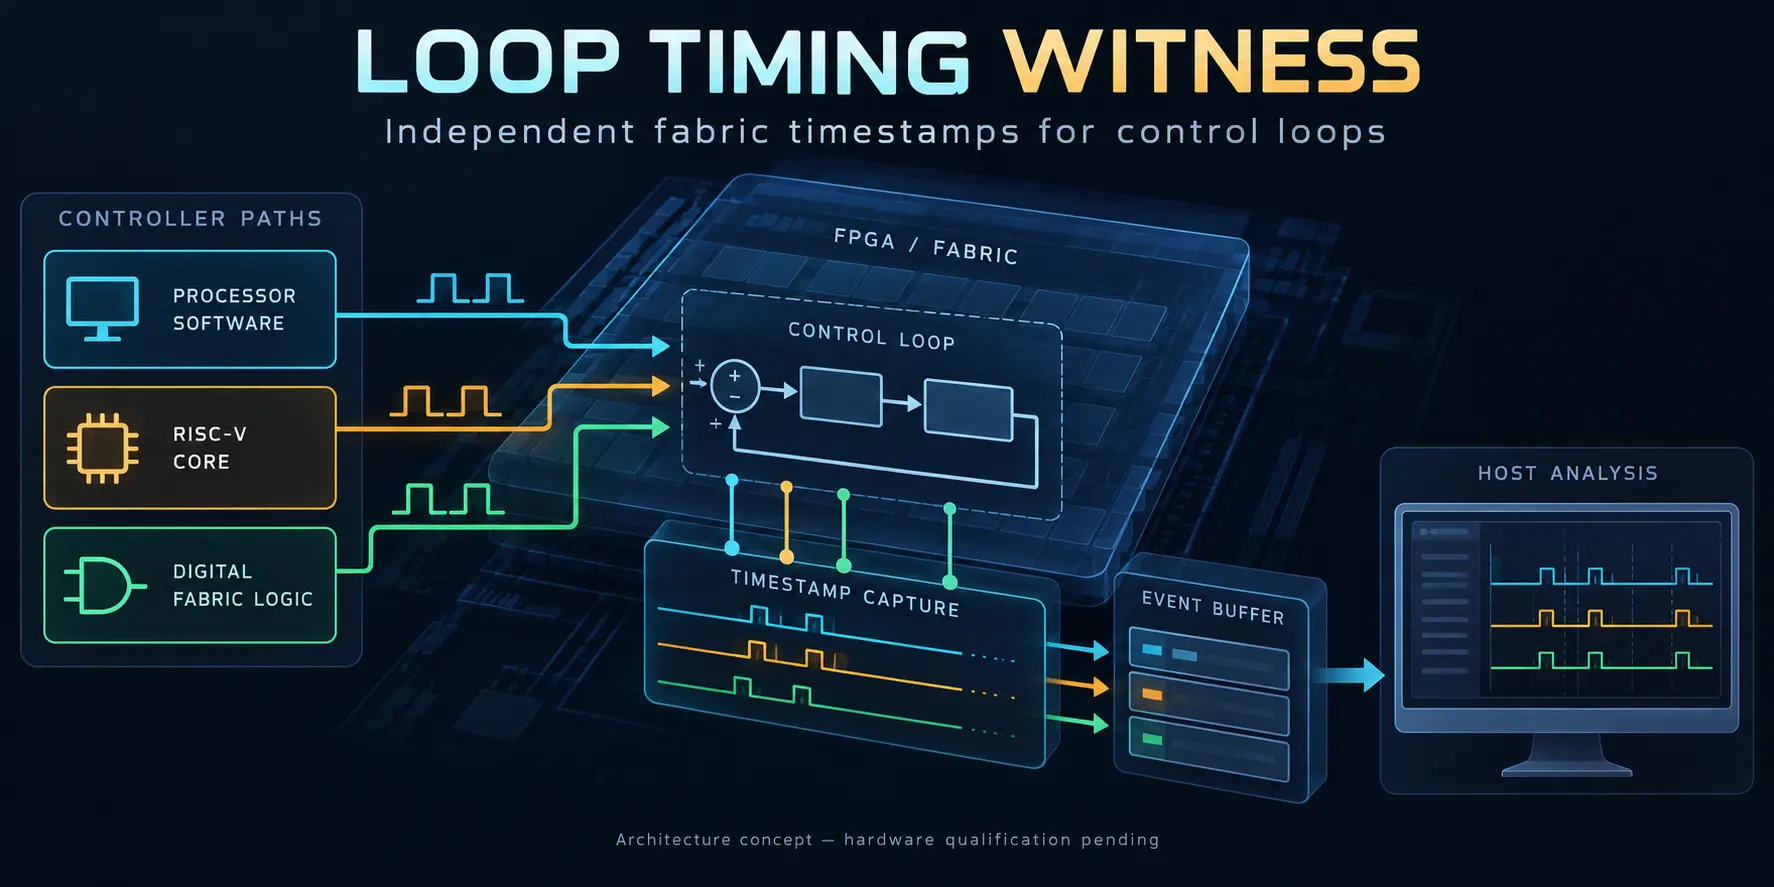
Illustrative architecture concept. Hardware qualification and board measurements remain pending.
An open measurement instrument, in design, that timestamps the events of a real-time control loop in FPGA fabric and reports latency, jitter, deadline misses, fault response and energy per control cycle on a PolarFire SoC board — independently of the processor whose software is being measured.
Evidence maturity: architecture_only. No board instrument has been built or measured. The
repository contains measurement contracts, fabric timestamp capture, a dual-clock buffer, plants,
references, PID and discrete LQR controllers with bit-exact C/Rust/RTL parity,
a deadline monitor and fault injector tested in RTL simulation, and a host analysis
command that reports simulation provenance separately from
board evidence. The capability and claim inventories remain empty and checked by the manifest
validator.
The measurement problem
Real-time control on embedded systems-on-chip is usually characterised by software that times itself on the processor under test: a timer wake-up benchmark, or timestamps logged by the control task. Those numbers share clock, scheduler and interrupts with the system being measured, often describe a proxy task rather than the control loop, and rarely come with energy per cycle or with the effect of latency on control quality. Moving a controller between a Linux task, a bare-metal core and FPGA logic therefore changes the measurement method along with the placement.
What the instrument is designed to do
For one closed control loop on one PolarFire SoC Icicle Kit, the planned instrument:
- timestamps every sample-ready, sample-read, actuator-write and deadline event in FPGA fabric on a 64-bit counter clocked at 100 MHz (10 ns resolution);
- reports latency and jitter as distributions (median, 95th, 99th and 99.9th percentile, maximum) and counts deadline misses in hardware;
- compares three controller placements under identical plant and controller definitions: Linux user space on the U54 application cores, a bare-metal loop on one U54 core in asymmetric multiprocessing, and fixed-point logic in fabric;
- relates latency to the tracking error of an emulated plant in the same run;
- estimates energy per control cycle from the board's PAC1934 power monitor, with the limits
stated in
docs/MEASUREMENT_PROTOCOL.md; - injects faults and measures detection and time to a defined safe actuator state;
- writes every run as raw event records plus a hashed manifest, so a run can be repeated and audited.
A second event profile, COMPUTE, applies the same event witness to fabric accelerators: input
write, compute start, compute done, output read and interrupt entry.
Who it is for
Engineers and researchers who must show measured loop timing instead of estimates: motor, power-electronics and motion control, laboratory hardware-in-the-loop set-ups, and teams that place computation in FPGA fabric and need its end-to-end latency on real hardware.
Evidence boundary and non-claims
- No board latency, jitter, deadline, energy or control-quality number has been measured. Functional simulation results and native regression timings are separately labelled.
- No physical board is currently available; development and verification use simulation.
- No statement about PolarFire SoC performance is made before a measured run with its manifest and hashes exists.
- No comparison with other vendors or platforms is part of the project.
- The target board has not been used yet; the platform facts in the manifest come from the board
user guide and are marked
verified_on_hardware: false. - Hardware timing measurement from FPGA fabric is established prior work (see below). The planned contribution is its application to complete control-loop events across three placements with control quality, energy and fault response in the same run, published as reproducible run records — not the idea of measuring from fabric.
Related work
- Alonso et al., "Interrupt Latency Accurate Measurement in Multiprocessing Embedded Systems by Means of a Dedicated Circuit", Electronics 13(9), 1626, 2024, https://doi.org/10.3390/electronics13091626 — a fabric circuit that measures the latency between two interrupt signals with one clock-cycle resolution and compares hypervisor and asymmetric-multiprocessing configurations on Zynq UltraScale+.
- Microchip Technology, "PolarFire SoC FPGA: Interrupt Latency and Data Transfer Throughput Measurements", white paper DS60001712B, 2021 — processor-side interrupt latency on the Icicle Kit measured with the RISC-V cycle counter.
- Puglisi et al., "Comparative evaluation of embedded platforms for real-time acquisition in plasma control and data acquisition systems", Fusion Engineering and Design 228, 115769, 2026, https://doi.org/10.1016/j.fusengdes.2026.115769 — bare-metal, FreeRTOS, Linux and FPGA placements of one acquisition loop, timed by server-side packet timestamps and an oscilloscope.
Relation to SC-NeuroCore
Loop Timing Witness is developed as hardware-validation tooling for
SC-NeuroCore, an open neuromorphic computing library.
The COMPUTE profile is designed to measure the memory-mapped write, compute, read and interrupt
path that fabric neuron peripherals use. No SC-NeuroCore code, model or adapter is part of this
repository: adapters that place such peripherals in the instrument's device-under-test slot
belong to the SC-NeuroCore repository and consume this repository's published manifest format and
interface. No SC-NeuroCore latency or energy on PolarFire SoC has been measured.
Explicit exclusions
- SC-NeuroCore source code, generated neuron peripherals, models or adapters.
- Controllers, plant models or physics from other projects; only textbook PID and discrete LQR controllers are in scope.
- Microchip Libero SoC binaries, licensed or encrypted IP cores and redistributed vendor reference designs; they are generated by scripts or fetched at a pinned revision.
- Board measurement results and platform performance claims until a measured run exists. Labelled simulation evidence and non-isolated native regression records are retained.
Architecture
The instrument architecture, event record format and verification plan are described in
docs/ARCHITECTURE.md. The repository boundary is fixed by
docs/adr/0001-repository-boundary.md, the measurement
procedure and its stated limits by docs/MEASUREMENT_PROTOCOL.md,
and the threat model by docs/THREAT_MODEL.md. The implemented simulation
and host file contract is in docs/HOST_ANALYSIS.md.
The source-bound vendor input procedure is in
hardware/icicle/README.md; no Libero or board result is claimed.
The system block diagram illustrates the planned PolarFire SoC Icicle Kit instrument.
The planned contracts are machine-readable in measurement-domain.json
(schema measurement-domain.schema.json): timebase, event
record layout, event profiles and the intervals derived from them, event buffer sizing, controller
placements and the run plan. Each run manifest binds a snapshot of this file by SHA-256. The
validator checks their internal consistency, for example that
the event buffer outlasts the slowest permitted drain at the highest sample rate and that the
timebase counter cannot wrap during a repeat.
The RTL stream contract is described in docs/FABRIC_WITNESS.md; the
integrated plant, monitor and injector are in docs/PLANT_WITNESS.md.
Controller arithmetic, design, native interfaces and simulation limits are in
docs/CONTROLLERS.md. Dedicated-hart firmware preparation, actual ISA
capture and analysis limits are in docs/AMP_SIMULATION.md.
The IRQ-free Linux AMP logger, mailbox startup and board qualification requirements are in
docs/AMP_LINUX.md.
Repository layout
| Path | Content |
|---|---|
measurement-domain.json, measurement-domain.schema.json |
identity, boundary and planned measurement contracts |
run-manifest.schema.json |
versioned, provenance-bound run input contract |
amp-capture.schema.json |
actual dedicated-hart ISA logger receipt and artifact custody |
amp-plugin-build.schema.json |
original generation/compilation, native compiler, SDK, source/header and link provenance |
capability-inventory.json |
generated public inventory, empty at architecture_only |
development-dependency-licences.json |
reviewed licence of every pinned development tool |
docs/ |
architecture, measurement protocol, threat model, decision records |
papers/ |
manuscript collection; no manuscript exists yet |
rtl/ |
fixed-point controllers, plants, monitor, injector, timestamp capture and dual-clock stream |
controllers/ |
dependency-free C and Rust kernels, streaming CLIs and API documentation |
runtime/rtl/ |
native process transport through the actual production AXI simulation |
runtime/linux/ |
UIO transport, native controller and AMP logger entries, bracketed PAC1934 IIO journal; hardware qualification pending |
benchmarks/ |
matching native workloads and labelled local regression records |
tools/ |
host analysis, validators, inventory generator, repository guards and preflight runner |
tests/ |
command-line, file and RTL-simulation tests |
.github/ |
workflow definitions, workflow inventory and contribution metadata |
Python package and native interfaces
The software package version is 0.1.0. It installs the typed
loop_timing_witness API, packaged JSON schemas and the
loop-timing-witness-analyze command. The package analyses existing hash-bound
run records; native simulation, firmware preparation and hardware access remain
separate source tools with the dependencies stated in VALIDATION.md.
Install the published host analysis package in a Python 3.13 environment:
python -m pip install loop-timing-witness==0.1.0
loop-timing-witness-analyze path/to/manifest.json --output-dir report
The standalone no_std Rust controller is published as
witness-controller:
[dependencies]
witness-controller = "=0.1.0"
Its versioned API reference covers the PID state, coefficient validation and LQR step. Native execution and board adapters remain source tools; the AMP kernel is not a registry crate.
From a source checkout with Python 3.13.15:
make venv
.venv/bin/loop-timing-witness-analyze path/to/manifest.json --output-dir build/report
The unreleased source analyser reports absolute adjacent-cycle latency jitter in JSON, summary and pair CSV files, and an SVG comparison. Counts expose missing pairs; warm-up and missing cycles are never bridged. This addition is separate from the published 0.1.0 artefact. See the definition and outputs.
The unreleased report writer supports Linux with capability-checked
renameat2(RENAME_NOREPLACE) publication. A destination created during staging
is preserved and the write fails. Other OS report publication remains unqualified;
the pure loading and calculation API below is independent of this native binding.
See the host analysis contract.
For programmatic analysis:
from pathlib import Path

from loop_timing_witness.analyze_run import build_report
from loop_timing_witness.run_manifest import load_run

report, cycle_rows = build_report(load_run(Path("path/to/manifest.json")))
Both entry points validate schema identifiers, source/file hashes and run
provenance before analysis. A simulation record remains labelled as simulation.
The actual package-consumer check, make python-package-tests, builds both wheel
and source archive, installs them into independent environments and analyses
events produced by the real Icarus RTL path.
The documentation website contains
the source guides and Python, Rust and C/C++ API references. Native interfaces are
documented in the controller contract,
the Rust crate README and the AMP runtime contracts.
make documentation-toolchain docs-site builds the source documentation, Python
pydoc, both Rustdoc references and the C/C++ Doxygen declaration reference into
build/docs-site. Python has NumPy docstring checks. Rustdoc rejects missing public
items, warnings and broken intra-doc links. Doxygen rejects undocumented public
declarations, structure members and enum values. The site build refuses publication
if any maintained language reference is missing.
Validation
Every gate and its exact scope are listed in VALIDATION.md. From a clean
checkout with Python 3.13:
make venv        # .venv from the hashed development lock
make preflight   # every local gate, failing closed on a missing tool
Security
Report vulnerabilities privately as described in SECURITY.md.
Licence
AGPL-3.0-or-later, with a commercial licence available; see NOTICE.md and
LICENSES/. Licensing metadata follows REUSE 3.x (REUSE.toml).
Citation
Citation metadata is in CITATION.cff.
The 0.1.0 source archive is published on
Zenodo and binds source commit 1d12e0342d5320f62182fef41709773f3c555b50.
The GitHub release
includes the same source ZIP and a provenance manifest with verified artifact hashes.
Published PyPI/crates.io 0.1.0 artifacts retain their original build provenance
and are not replaced by the later source archive.
Cite the software version and the commit you inspected. Software version numbers
do not establish physical board qualification or measured platform performance.
Native source-bound simulation capture is available through
tools/capture_native_simulation.py; see the
host analysis contract for configuration,
retained source/binary provenance, the bound parent Python producer context and
observed tracking coverage. Optional
Linux host load profiles retain actual bounded
worker activity and scheduling facts; all captures remain simulation-only.
Support development
Support the project through GitHub Sponsors, Buy Me a Coffee, Stripe, PayPal or TWINT. For commercial licensing, contact Anulum.